Sunday, December 6, 2009

Week 9: GIS Applications - Census Data


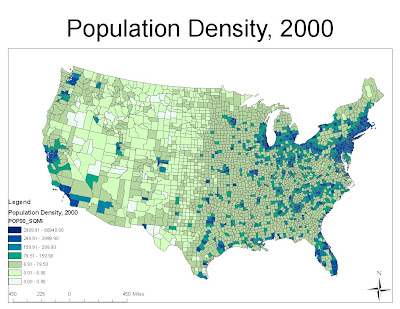
This week we analyzed census data from 2000. We first started with the raw data provided by the government and mapped out the difference in the number of people from 1990 to 2000, the total number of people in 2000, the population change by percent from 1990 to 2000, and the population density in 2000. Just by looking at the maps, we can see why they are useful. Looking at the difference in population changes, we see that the Midwest saw a big drop in population, while the key cities like Los Angeles and Sacramento saw a huge jump, just to name a few. If we then look at the percentage change map, we can see that those cities saw about a 20% growth, while cities in Nevada and New Mexico saw a growth of upwards of 50%. Looking closer at the percentage change, we can also see that some portions of the Midwest, especially the colder climates lost a minimum of 10%. Looking at the number of people map for 2000, we can see that most of the country’s population is located on either the West or East Coast. This is where the large cities are, and looking at the population density map, we can see that this is indeed true. By just performing these simple analyses, we can see these simple correlations. That is what makes maps so useful.

Looking at the Black Alone Population Census Data, we can easily see the breakdown of where the African Americans are located. Most of them currently reside in the Deep South, as that is where many of them were originally located. We do see that there are some located in other parts of the country, but from the map, it looks like no more than 10% ever leave the Deep South in any single county. Looking at the South, we do see that it is not unusual to see upwards of 25%, even 50% in many parts. This data could be looked at and be used to see where a minority president, such as President Obama, might see a surge of support from.

Taking a look at the Asian Alone population map, we can see that many are located on the West Coast with some along the north Eastern Seaboard. This could easily be explained by the fact that many come across the Pacific Ocean and tend to stay where they land. We see that in the center of the United States, there is almost no percentage of Asians, as this is a longer journey. Looking into our history books, we can notice that many Chinese men came by boat, and worked building California’s intensive railroad networks. Once they were built, many decided to stay. Noting that they came by boat, as this was a cheaper form of transportation, and while the railroads were built, airplanes were a very new thing, we can explain just why there are so few currently located in the Mid United States.

Again, we look at the minorities in the United States and can see that many of those counties lay in states that border Mexico. There is a pretty obvious explanation, in that many minorities come from Mexico. Many Mexican’s crossed the border to seek better lives, but as we have seen from our other analyses, many people do not move once they are settled in. Now that border regulations have gotten stricter, many immigrants are traveling to Mexico and crossing, as Mexican regulations are no where near as strict as the United States are. These results are not against what we expected to find, and can be used to help decided whether or not it would be a good idea to cater to a certain race in certain areas of the country. For example, it would probably be a bad idea to put a Mexican restaurant it North Dakota, but would probably be a good idea to put one in Texas.

By simply obtaining the data from the government and plotting it using GIS, we can draw many of these conclusions. These conclusions can help make decisions that might require further insight than just saying that we are going to tear this down or build this here. GIS is a marvelous tool, but must be carefully used as the tool is only as good as its user. There are many biased maps made to drive a certain point across. Many distinctions must be made, but this software helps draw conclusions to data. What used to take weeks can now be done in minutes. This software has so much potential. It can be used to see how herds migrate, to map how race distributions are changing all over the country, to who knows what. GIS is the future.

Monday, November 23, 2009

Station Fire

It is believed that on August 25th 2009 that the Southern California's Station fire began. The fire claimed just over 160,000 acres of land, destroying 209 structures, of which 89 were homes. It is believed to have been started at a Ranger Station on Angeles Crest Highway. Amazingly only two firefighters were killed trying to escape the flames as their fire truck plunged off a cliff. This fire threatened 12,000 homes and cost 93.8 million dollars to fight. During this whole ordeal, many individuals were displaced from their homes on the surrounding areas.
The fire burned through La Canada, Flintridge, Glendale, Acton, La Crescenta, Pasadena, Littlerock, Altadena, Sunland, and Tujunga. Many of these areas had to be evacuated due to the high risk and danger of the fire. They closed down many roads and highways for the publics s
afety as the fire continued to burn dangerously close to both homes and highways. The greatest lost could have been the communication towers on top of Mount Wilson, for which all local television stations broadcast from, most of the radio stations broadcast from, and of course the radio relays that the Los Angeles fire department use. This could have been a devasting lost, had it not been saved.
On September 3rd, officials announced that the fire may have been caused by arson, as they found traces of a substance believed to have accelerated the fire. At that time, officials opened a homicide investigation to try to locate who started the fire. This fire is the largest fire in Los Angeles's modern history and the 10th largest in all of California's modern history. Many individuals are asking for a congressional investigation to why the fire was not contained within 48 hours, before it got to big.
As of now, the only highway closed is a 40 mile stretch of Angles Crest Highway due to damage not only to the guard rails and signs. The pavement is believed to be intact, but until it is deemed safe, it is closed. This is pretty remarkable knowing that this could have been much worse. As of September 6th all evacuation notices have been lifted and the fire seemed to be under control. By September 15th, the fire was 91% contained, and on October 16th it was deemed 100% contained.

As Supervisor Mike Antonovich said "I'm very sorry to say that much of the local television news coverage, that used to be covering fires live, is not covering this fire necessary to inform our people." He said this because it used to be that local news crews would cover the fire to keep an eye on homes, but now they are merely covering the fires because they feel they have to, but no longer want to. There is more an interview fire chiefs than report on what is actually burning. This leads to people only knowing that there is a fire, but not what individual homes are being threatened.


Sunday, November 15, 2009

DEM's in ArcGIS


Orginal Elevation Map

Shaded Relief Map
Slope Map
Aspect Map

3-D Rendering

Top : 37.7372222215
Left : -119.133333333
Right : -118.242222222
Bottom : 37.1247222215
GCS : GCS_North_American_1983

While looking at the map of the United States, I decided that I wanted to choose an area that had high elevation differences, and so I chose an area located in Central California. The area I ended up choosing was where the following four counties met, Mona County, Fresno County, Madera County, and Inya County. Instead of telling a little about each county, I decided to write just about one. The one I chose was Fresno County. It was founded in 1856 and is currently just over 6,000 square miles. Fresno is also the tenth most populated county in California. It is considered to be the most agriculturally rich county in the United States and currently supplies food to companies such as Sun-maid Raisins, Del Monte Foods, and Kraft just to name a few. On the east is the Sierra Nevada mountain range, which is featured in the above maps. The Sierra Nevada mountain range currently stretches 400 miles and runs both in California and parts of Nevada. Development of the surrounding areas is highly regulated and much of it is protected by the National Park Service.

Monday, November 9, 2009

ArcGIS Map Projections


Map projections are amazing things, as they help us take our three dimensional world that we live in, and turn it into a two dimensional world that we can take in our pockets. There are many different map projections, and everyone has pros and cons to it. For example, we can first look at conformal map projections. They preserve shapes and angles to places. When we use this projection, we can get a sense of where we are going, but the further away from the equator we use this map, we can see just how inaccurate this can be. It does help locate ourselves in the world, but does not preserve area or distances that well. When we take a look at how far it is between Kabul and Washington D.C. we can see that both the Mercator and Gall Stereographic projections estimate the distance at somewhere ovr 10,000 miles when it should be closer to something like 7,000 miles. We see just how bad these maps can be, yet they give us a very familiar representation of the globe.

Next we look at Equal Area projections, which as the name suggests represents equal area. As we can see from the photos, tends to squish the globe a little bit. It is good for keeping consistent area throughout the globe, and this may be useful to determine the amount of rainforest that was burned down or logged. These maps would be useful to map out and accurately measure area on the globe, however, they do not keep distance as well as they should. I chose to represent the sinusoidal and Hammer projections and the distance recorded from Kabul to Washington D.C. happens to be represented as just over 8,000 miles and just over 12,000 miles respectively. The only reason that the sinusoidal projection is close to the magical 7,000 miles is that it is also equidistant, which makes this map useful in more than one way. We can see that these maps do have a use, but representing distances is not one of them.

Our final map projection we look at is Equidistant, and as it sounds it represents distances from a centralized point as the same. The two projections that I chose are the Cylindrical and Conical projections. We first look and notice that the cylindrical projection tends to squish the globe, but maintains the equidistant relationship from a centralized point. As we look at the conical map projection, we see that the distance from a centralized point is pretty equal. These maps are the best for calculating distances, which turn out to represent the distance between Kabul and Washington D.C. as 5,000 miles for the cylindrical projection and 7,000 miles for the conical projection. Looking at the true distance between those two cities, we can note just how close that the conical projection came. As predicted, it did not distort the distance between those two cities too much.

These map projections have a lot of potential because if one wanted to misguide a community by just looking at a map, they could choose a projection in which their point of view is greatly exaggerated and raise concern for their point. Most of the time we accept the map for how it looks, without question, and this is where we could get into trouble. If one were to use a Mercator projection to look at farmland, and noticed that there was not too much compared to what was set aside for development, they might have to figure into account that the farther away from the equator you get, the greater the area distortion is. This can either be used for good or evil, as it can stir certain people into accepting certain facts, but one must be careful to note what they are doing with representing the information that they were given.

Monday, November 2, 2009

ArcGIS Photos

Here are some of the earlier photos as I made my progress through ArcGIS.


ArcGIS

Today I got my first look at ArcGIS. It took a little time to load, but once it was up and running we were good. The first thing I noticed is that it is set-up very similar to how you think it should be set-up. It has organized toolbars that we are so very much used to along with a very Microsoft like set-up, having the drop down menu’s. I then started the tutorial up to start my first project of an airport expansion. After the map loaded, I noticed that it then looked very much like Adobe Photoshop, as it was designed to have layers in which you could move, modify and choose which layers are to be seen. Once you go though the tutorial, you can see just how this software is indeed designed to work.

For this tutorial, I first started off with a general map of an airport with schools located nearby. I was then asked to locate the schools that would be affected by the noise due to the airport expansion, and was able to see that one school would be affected. From there, I was asked to see how the rest of the land was being used around the area of interest, from which I was able to make a bar graph. After I found out how the land was being used around the airport, I was asked to make a population density map to see just how many people would be affected with the new airport expansion. I was then asked to modify a road leading to the airport and highlight it on the map. Finally I was asked to clean up the maps and present it a clean fashion such that it may be used to present a point to City Planning. This was all done in a few short hours, showing me just how helpful this software can be.

This software has an amazing capability to get a message across in our universal language as human beings. We can then present our information in a reasonable fashion and get a clear message across. For example, we could make a map of forest fires are make reasonable predictions for which land might be susceptible to flooding during the rainy season. This could then serve as a preventive measure allowing people to either compact the soil, or be forewarned when there is a high chance that there could be flooding in that area. This is just one example of how this software can be used to help get a point across, and potentially save lives.

However, we must be forewarned that this software could also be used to drive bias points across as well. A good example of that is logging communities. Let's say that a portion of the amazon rain forest was cut down for lumber and another was burned down due to natural causes. If one were to make a graph showing the changes in tree density for that general area, one could omit the fact of the fire and make the conclusions that a big portion of that forest was lost due to logging. This example introduces a lot of bias towards the fact that logging is bad and that it is devastating the land, when a portion of that would have been done due to natural causes anyway. It over exaggerates the effects just to drive a point across. Even though this software has great potential, it must be checked. In the words of Uncle Ben from Spiderman, “With great power, comes great responsibility.”

Tuesday, October 13, 2009

The Glorious Strip


View The Strip in a larger map

Above is my map of The Las Vegas Strip. I made this using Google Maps and tried to include most of the major hotels and casinos. My map could of course be wrong, as maps are constantly being updated ll the time. For example, I was forced to use Google Maps, and it said that there was a hotel and casino where there wasn't one. It had been destroyed 2 years prior, yet Google had not updated it. As it stands now, it is just an empty lot, but to many people who will go and look at a Google Map of The Strip, they will see the hotel that is no longer there. Nowadays anyone can create a map using a toolkit. I feel that this means that people will tend to not get lost as often. This new type of geography let's anyone control how they want to view their maps, and reduces the potential of people getting lost. However this is not always the case, as my good friend Anooj found out. I gave him a printout of google map directions to get to our campsite that we were going to, however Anooj looked the directions over and took off. Needless to say I get a call an hour later saying that he is lost, so I pull out the trusty old Thomas Guide and get him going in the right direction. These new maps help people get to where they are going, but not understand why they have to take this highway or do this turn. These new maps give people a false sense of hope in thinking that they know where they are going, when this is not always the case. If people do not have a map which they can translate to their mental maps, they can easily get lost. Many times when you printout a map from google maps, you are able to adjust how big you wnat the map to be, but when someone else gives you a map prinout, it could be confusing ot knowing where you are going.

On the other hand, we have such great acess to maps, that anyone can print one out to the size of their liking. I know some of us have those great old maps that fold out to size of the car to help you get where your going, but sometimes we don't need something that big. This is where we adjust the size and make the map to our liking to help us get where we are going. These new maps help us express where we are going and how we are going to get there. If I told you to go to Las Vegas, I am sure that you could probably get there, but that is becasue almost everyone has been to Las Vegas. Now if you have never been, you would go out and look on a map where it it, but as you can see Las Vegas is a pretty big place. Most of us stay to The Strip or around that area, and thus you can go and look up just where you want to be on The Strip rather than a map of all the surrounding areas. Sure some of us would like to take a tour of the Hoover Dam or the Grand Canyon while we are there, but if we were to use the same map for both of these actions, the maps would have to be huge. Nowadays, we just tell them where we want to go, and they will gladly print you a map. This new map technology is limitless as, just think about it. We have iPhones, GPS, and the fact that we do not have to stop and make a call. This has just happened over the last 20 years, yet maps have been around for hundreds if not thousands of years. If this is us now, where will be in 10, 20, or 30 years from know.